
Overview
SQL views are the backbone of effective data analysis in Kroo. They transform raw, messy tables into structured, standardized, business-ready datasets that anyone can query. This comprehensive guide covers everything from basic concepts to advanced implementation strategies.What Is a SQL View?
A SQL View is a saved query that turns raw, messy tables into a structured, standardized, business-ready dataset inside your Kroo Warehouse. Instead of rewriting the same joins and filters, a view stores the logic as a virtual table that anyone can query.Think of it like a recipe: The raw ingredients (tables) are available in your warehouse, but the view is the finished dish—measured, mixed, and ready to serve.
Views Can:
- Select only the fields you care about - No more overwhelming spreadsheets
- Aggregate values (SUM, AVG, COUNT, etc.) to roll data up to the right level
- Join across tables to connect information that lives in different places
Where Views Can Be Used
- Within a Single Schema
- Across Multiple Schemas
Shape a single system into clean tablesExample: Transform Procore data into clean tables for RFIs, Submittals, and Change Orders
Key Takeaway
Views act as the glue between systems, turning siloed construction data into a single source of truth.
Why Views Matter in Kroo
Simplify Complexity
Abstract away technical details
- Users don’t need to know which raw tables to query
- Logic is centralized and reusable
- Reduces learning curve for analysts
Ensure Consistency
Standardize business definitions
- How Committed Cost is calculated
- How Percent Complete is defined
- Every report uses the same logic
Boost Performance
Optimize query execution
- Predefined logic reduces repeated heavy queries
- Streamlines dashboard refreshes
- Better resource utilization
Integration Ready
Connect to any tool instantly
- Power BI, Tableau, Kroo Data Visualizer
- End-users see insights, not raw data
- Self-service analytics enabled
Advantages of Using Views
1. Data Customization
Translate raw system codes into business-friendly values that make sense to your team.Business Value: Views eliminate the need to remember cryptic system codes and provide consistent, readable data across all reports.
2. Data Aggregation
Summarize key numbers once and standardize calculations across your organization.Consistency
Standardized calculations
- Single source of truth for metrics
- Eliminates calculation errors
- Ensures consistent reporting
Efficiency
Compute once, use everywhere
- Reduces query complexity
- Improves report performance
- Simplifies downstream analysis
3. Cross-System Reporting
Merge operational project data from Vista with financials from Procore for comprehensive insights.Integration Power: Views enable seamless data integration between different construction management systems, providing a unified view of project performance.
How Views Fit in Your Data Architecture
Views act as the critical bridge in your Kroo data pipeline, connecting your warehouse schemas to visualization tools: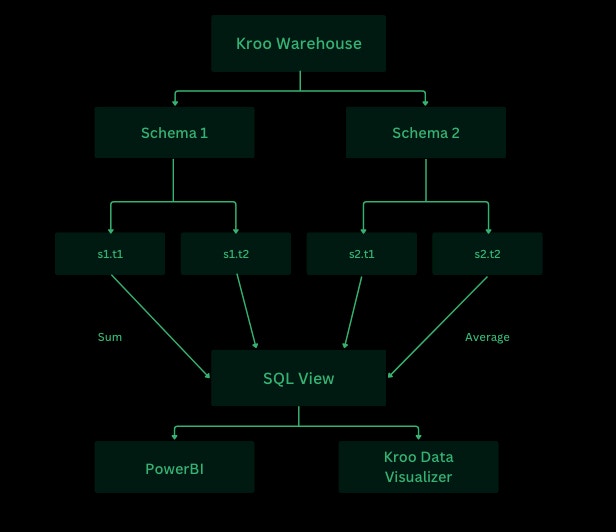
SQL Views aggregate data from multiple schemas and feed clean datasets to your BI tools
Key Insight: Views aggregate data from multiple schemas (s1.t1, s1.t2, s2.t1, s2.t2) using functions like SUM and AVG, then feed clean, business-ready datasets directly to your visualization tools like Power BI and Kroo Data Visualizer.
Essential Kroo Query Requirements
The _fivetran_deleted Filter Explained
Kroo uses soft deletes to maintain data integrity. When records are “deleted” in source systems, they’re marked with _fivetran_deleted = 1 rather than being physically removed. Always filter these out:
Understanding Internal Metadata Columns
Important: Any column in the Kroo warehouse starting with an underscore (
_) is internal metadata added by Kroo’s data pipeline. These fields did not come directly from your source system._partner_id- Internal identifier used by Kroo’s sync system (do not use in queries)_data_type- Internal classification for pipeline processing (do not use in queries)_fivetran_synced- Timestamp of last sync operation
_fivetran_deleted field is the only internal metadata column you should actively use in your queries - it’s required to filter out soft-deleted records.
Best Practice: When selecting columns for your views, focus on business data from your source systems and avoid internal metadata columns (except for the _fivetran_deleted filter in WHERE clauses).
SQL Query Building Blocks
Understanding the core SQL components will help you build effective views. Think of these as the essential ingredients in your data recipe.The Core Building Blocks
1
SELECT - What You Want
Choose the columns and metrics you need for your analysis
2
FROM - Where It Lives
Specify the source table(s) containing your data
3
JOIN - Connect Related Tables
Link tables together to combine related informationCommon Join Types:
INNER JOIN→ Only matchesLEFT JOIN→ Keep all from left + matches on rightFULL OUTER JOIN→ Everything, matched or not
4
WHERE - Narrow It Down
Filter rows to include only the data you need
5
GROUP BY - Roll Up
Aggregate data into meaningful categories
6
ORDER BY - Sort Results
Organize output in a logical sequence
Complete View Example
Here’s how all the pieces come together in a real view:Best Practices
A. Query Writing & Readability
Formatting Standards
Follow these formatting rules for maintainable code:
- Use uppercase SQL keywords (SELECT, JOIN, WHERE)
- Indent and line-break for clarity
- Avoid SELECT *: Specify exact columns
- Meaningful aliases: Use short but clear names (p for projects, not x)
- Comment business logic: Document filters and calculations
B. Performance & Efficiency
1
Filter Early
Apply WHERE clauses before joins when possible to reduce data processing
2
Join on IDs
Use numeric IDs or surrogate keys, not text fields for better performance
3
Aggregate Once
Perform aggregations in SQL rather than repeatedly downstream
C. Data Integrity & Accuracy
Ensure your views produce reliable, accurate results:- Handle Duplicates
- Manage NULLs
- Correct Data Types
Use DISTINCT or proper grouping to prevent duplicate records:
D. Naming & Organization
Clear View Names
Use descriptive names
project_financial_summary✅pfs❌
Schema Placement
Organize by purpose
- System-specific views:
kroo_<system_name>_reporting - Cross-system views:
kroo_reporting
Where to Create Views
Choose the right location based on your view’s purpose and lifecycle:1
SQL Scripts
Temporary views for SSMS testing
- Use for development and experimentation
- Delete after testing is complete
2
Production Views
Save in correct schema for permanent use
kroo_<system_name>_reportingfor system-specific views- Example:
kroo_procore_reporting,kroo_p6_reporting
3
Cross-System Reporting
Place under kroo_reporting for integration views
- Combines data from multiple source systems
- Accessible across different schemas
Organization Tip: Consistent schema organization makes it easier for your team to find and maintain views over time.
Connecting to Your Data Warehouse
Once your views are created, you can connect to them using various tools. Here’s how to access your Kroo warehouse:Connection Setup
1
Navigate to Infrastructure
In your Kroo dashboard, click on the Infrastructure tab to see your available resources
2
Access Connection Details
Find your Azure SQL Warehouse (status will show as “Running”) and click Connection details
3
Configure SQL Server Connection
When connecting via SQL Server Management Studio or similar tools, use these settings:Login Tab:
- Server type: Database Engine
- Server name: Your provided server name (format:
kroo-sql-[identifier].database.windows.net) - Authentication: SQL Server Authentication
- Login: Your provided login credentials
- Password: Your provided password
- ☑️ Remember password (optional)
- Connection Security: Mandatory
- Encryption: Mandatory
- ☑️ Trust server certificate
4
Connect Your Analytics Tools
Use these same connection details in Power BI, Tableau, or other BI tools to access your views directly
Connection String Format: Your server name will typically follow the pattern
kroo-sql-[unique-identifier].database.windows.net - use exactly as provided in your connection details.Advanced View Patterns
Monthly Financial Summaries
Create rolling monthly reports with standardized date handling:Project Health Dashboard
Combine multiple metrics into a single project health view:Troubleshooting Common Issues
View Creation Fails
Common Causes:
- Missing schema permissions
- Invalid table references
- Forgot
_fivetran_deleted = 0filter - Syntax errors in SQL
Performance Issues
Common Causes:
- Missing indexes on join columns
- Complex calculations in SELECT
- Too many JOINs
Data Inconsistencies
Common Causes:
- NULL values not handled
- Different data types in UNION
- Missing WHERE filters
Learning Resources
Ready to expand your SQL skills? Here are recommended resources:SQL Tutorial
For comprehensive SQL learning, visit the GeeksforGeeks SQL Tutorial to build your foundation.
Next Steps
Start Building
Ready to create your first view? Begin with simple data customization using the patterns above.
Advanced Integration
Need help with cross-system reporting? Contact your implementation team for guidance on complex integrations.
Need Support?
Have questions about SQL views or need assistance with complex queries? Reach out to implementations@getkroo.com for expert guidance.